Air Quality & Burning Season
How to Check AQI & PM2.5 in Chiang Mai
Monitor Chiang Mai air quality reliably — IQAir vs Air4Thai, reading PM2.5, what the numbers mean and setting alerts.
5 min read
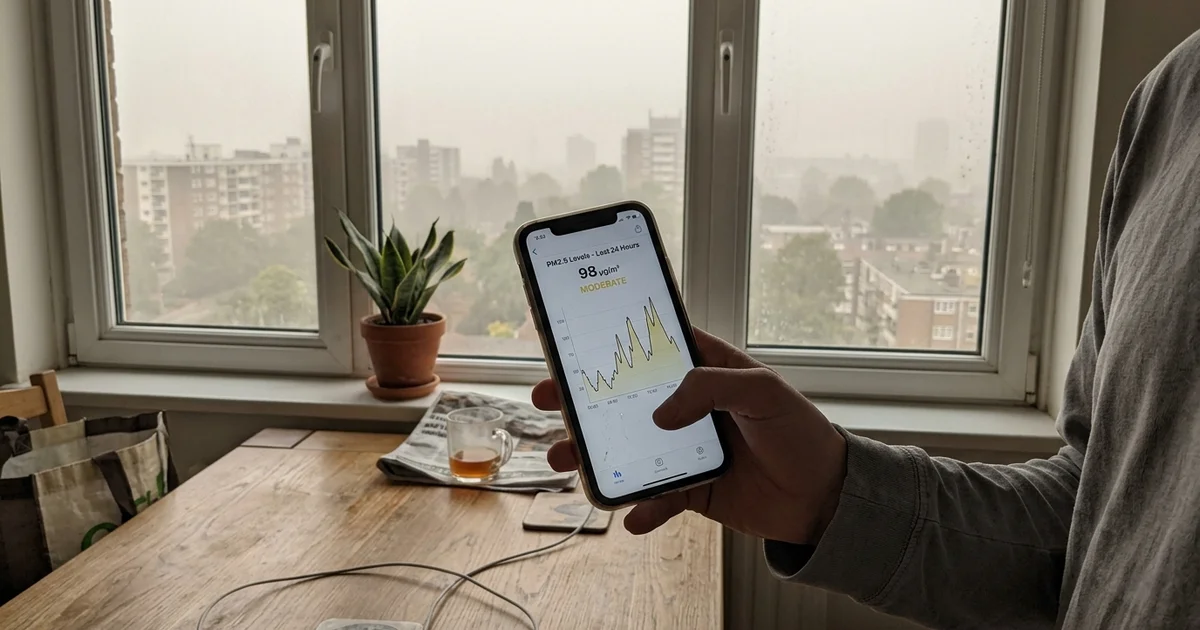
Two numbers, not one
Most air quality apps lead with AQI, a scaled index designed for easy comparison. It’s useful, but it hides the underlying measurement and different countries calculate it differently.
The number that actually matters for your lungs is PM2.5 in µg/m³ — the raw concentration of fine particulate matter. Learn to read that directly and the readings stop being abstract.
This guide sits under our burning season hub, which covers the causes and the mitigation.
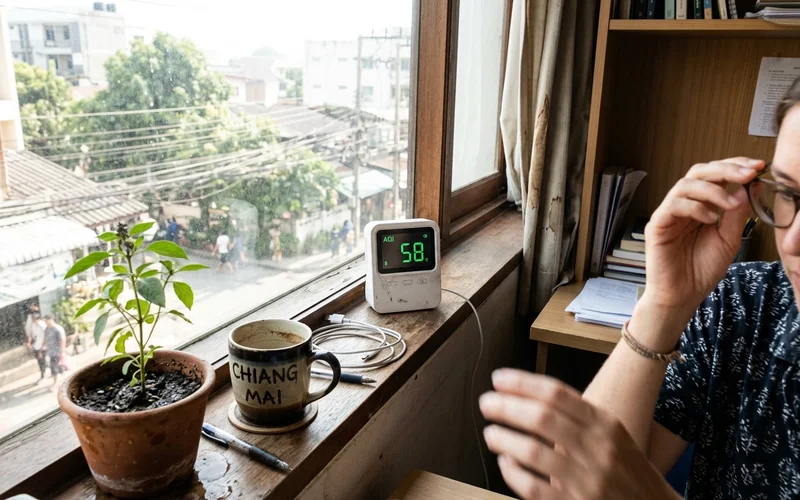
The sources residents use
IQAir is the default for most people here. It aggregates official monitoring stations and a large network of private sensors, shows a map, and displays both AQI and raw PM2.5. The sensor density around Chiang Mai is good enough to see genuine variation across the valley.
Air4Thai is the Thai Pollution Control Department’s official source. Fewer stations, government-calibrated equipment, and the authoritative reference when numbers are disputed.
Personal monitors. A desktop PM2.5 monitor costs a few thousand baht and tells you what’s happening in your actual room rather than at a station two kilometres away. If you’re running purifiers, this is how you find out whether they’re working.
Use a public app for the outdoor picture and a personal monitor for the indoor one. They answer different questions.
Reading the numbers
Working bands most Chiang Mai residents settle on:
| PM2.5 (µg/m³) | Practical meaning |
|---|---|
| 0–12 | Excellent. Windows open, exercise outside |
| 12–25 | Good. Normal life |
| 25–55 | Moderate. Sensitive people notice it. Purifier on at night |
| 55–100 | Unhealthy. Mask outside, limit outdoor exercise, purifiers running |
| 100–150 | Very unhealthy. Stay indoors, seal the room |
| 150+ | Hazardous. Minimise all outdoor exposure |
These are practical thresholds, not medical advice. If you have a respiratory condition, your personal thresholds should be lower.
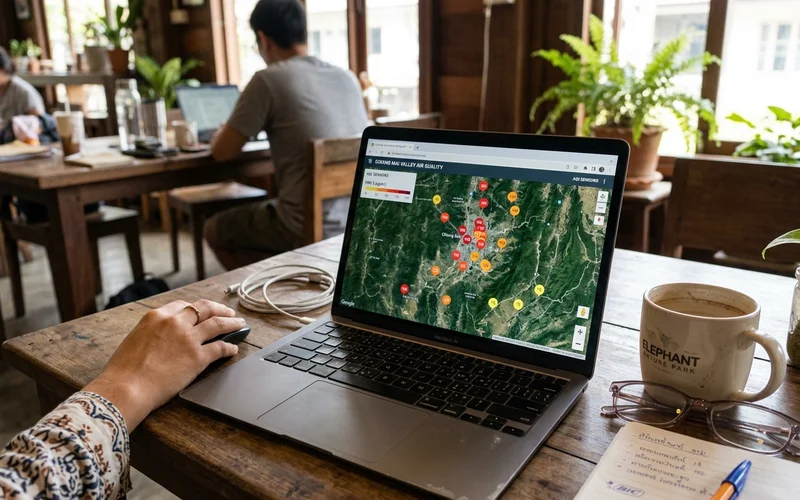
Location matters
Chiang Mai is not a single air quality reading. On a given morning you can see meaningfully different numbers between the Old City, Nimman, Hang Dong, Mae Rim and the higher ground.
When you check, look at the sensor nearest to where you actually are, then a couple of others nearby to sanity-check. A single sensor can drift, sit next to a construction site, or simply be indoors by mistake.
Setting up alerts
Two settings worth configuring once and forgetting:
- A threshold alert at whatever number changes your behaviour — commonly 55 µg/m³. The app tells you when to close windows rather than you remembering to look.
- A morning summary, because the daily peak often comes early and the decision about whether to run or cycle is made before breakfast.
Building a routine
During the season, a workable habit is:
- Check at wake-up. Decides windows, exercise and mask.
- Check before going out in the afternoon.
- Watch the trend, not the spot value. A rising number over three hours matters more than a single high reading.
- Cross-check indoors with a personal monitor to confirm your purifiers are actually keeping up.
Once your indoor numbers are consistently low, the outdoor readings become a planning tool rather than a source of anxiety. Our guide to sealing your room and staying indoors safely covers how to get there.